What Is a Double Bubble Map? Examples, Steps and Template Ideas
A double bubble map compares two things: shared traits in the middle, differences on the outside. See examples, a step-by-step method and common mistakes.
A double bubble map puts two things side by side so you can see what they share and where they differ. Here is how it works, with examples you can copy.
Sort your comparison notes into a mind map first →
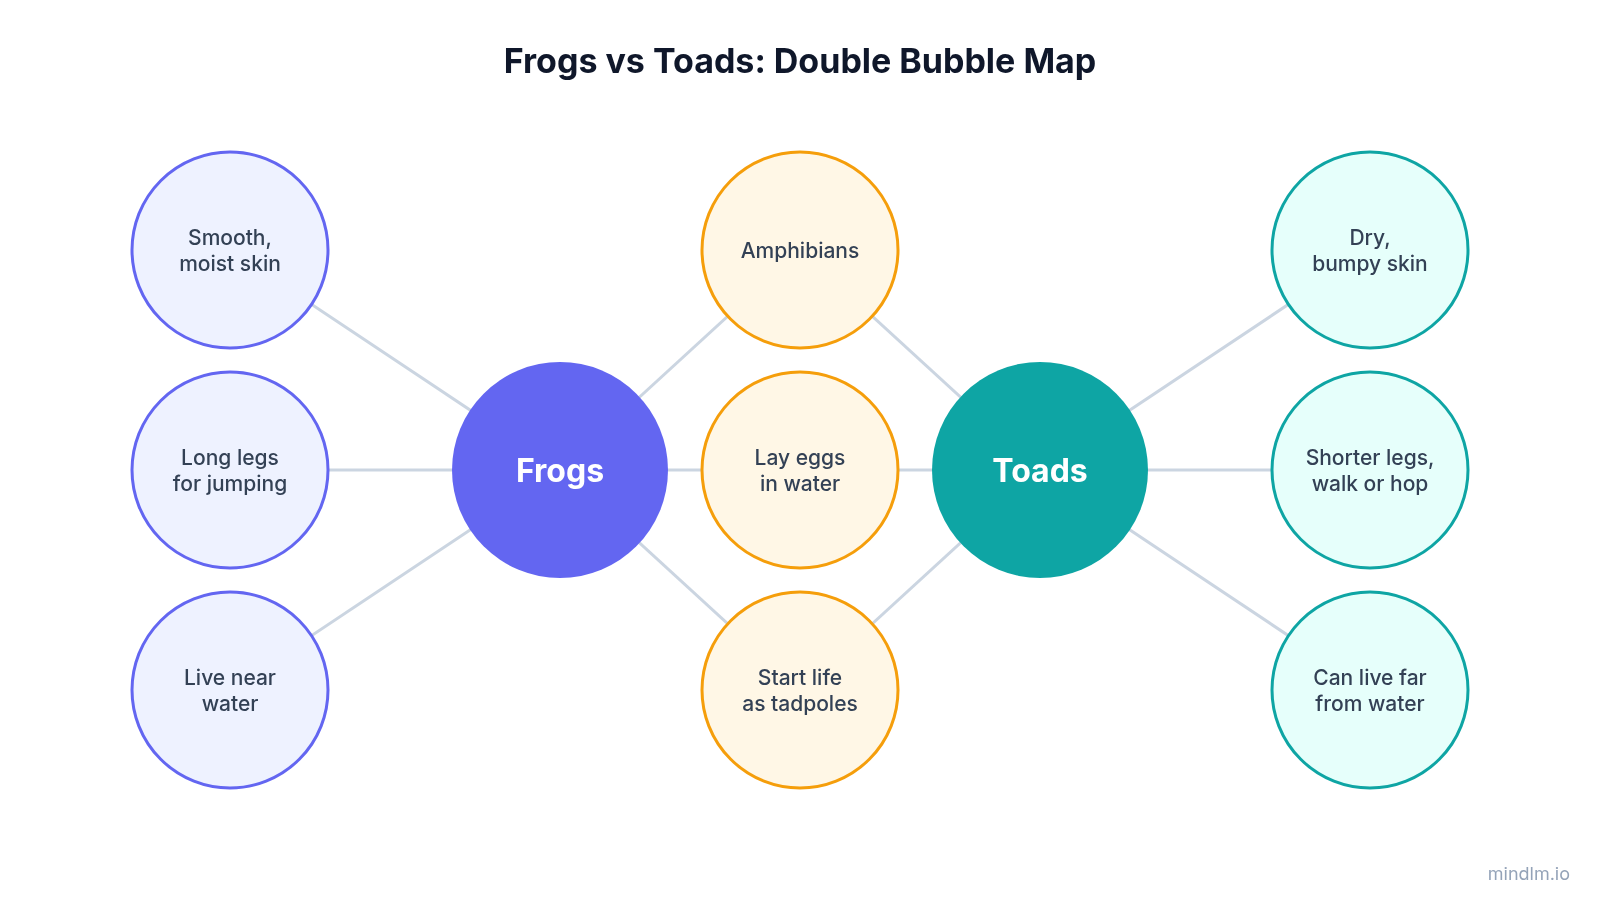
A double bubble map comparing frogs and toads.
A double bubble map is a compare-and-contrast diagram. You draw two large circles for the two things you are comparing, put the traits they share in bubbles connected to both, and put each item's unique traits in bubbles connected to only one side. When you finish, the left and right edges show the differences and the middle column shows the overlap.
It is one of the eight Thinking Maps, a set of visual tools developed by educator David Hyerle and widely used in US elementary and middle schools. That is why most people meet the double bubble map as a class worksheet. The format works just as well for comparing two job offers, two software tools or two historical figures.
How a double bubble map is laid out
The structure is fixed, which is what makes the diagram quick to read.
- Two center circles. One for each item: Item A on the left, Item B on the right. Keep the labels short, a noun or a name.
- Shared bubbles in the middle. Each one connects to both center circles. These are the similarities.
- Unique bubbles on the outside. Bubbles on the far left connect only to Item A; bubbles on the far right connect only to Item B. These are the differences.
The lines carry the meaning. A bubble with two lines means "both". A bubble with one line means "only this one". If you remember that, you can read any double bubble map in a few seconds.
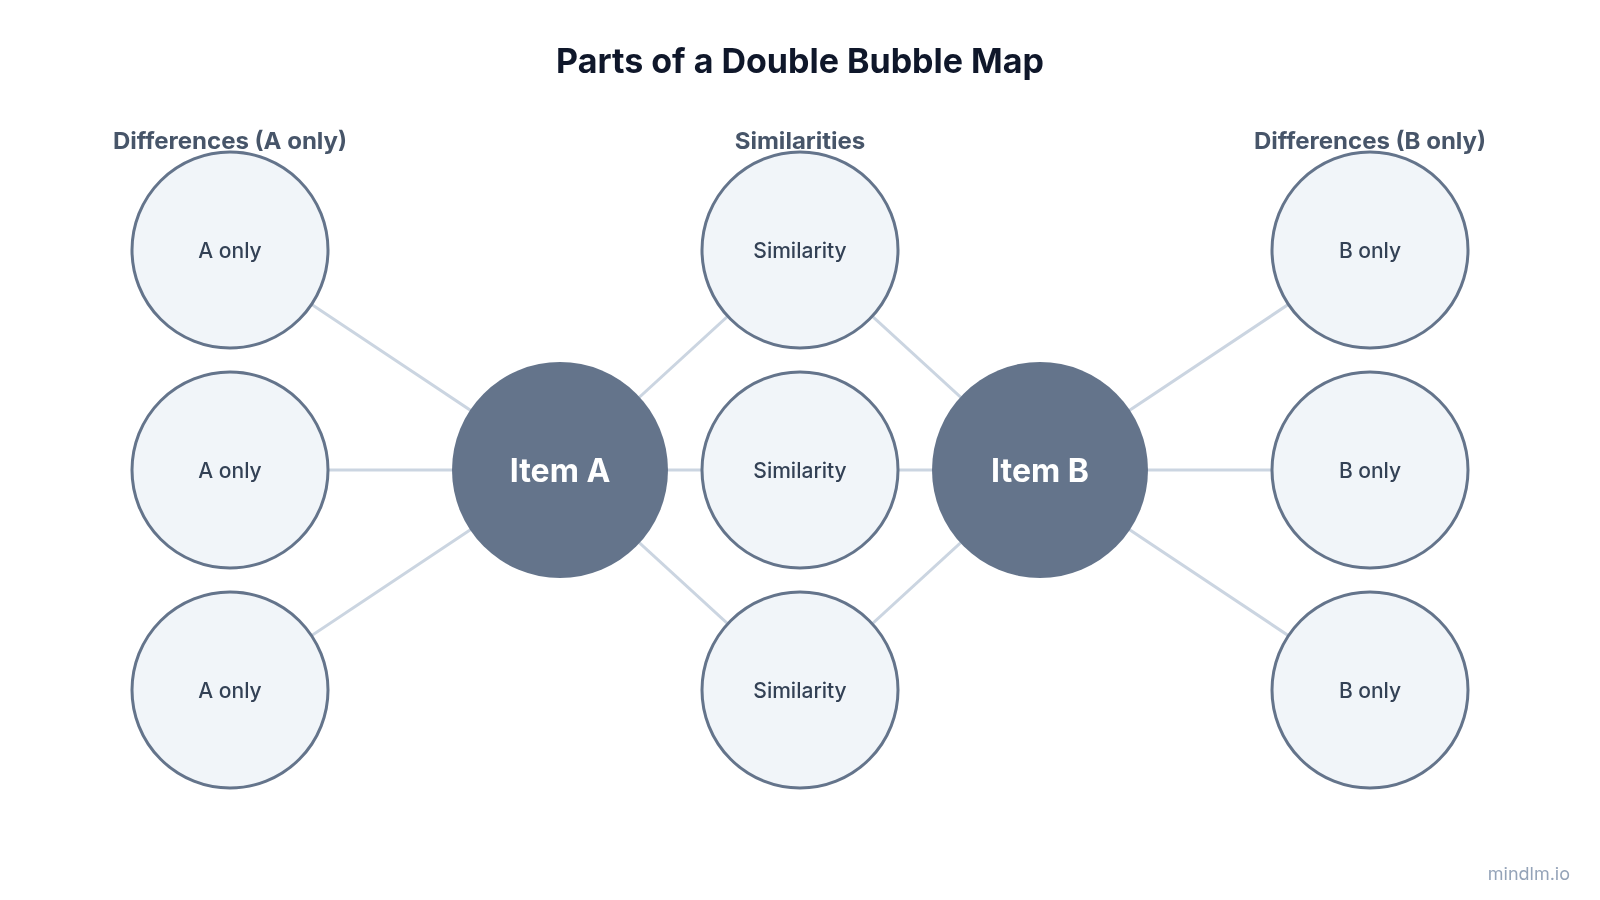
The parts of a double bubble map.
Double bubble map vs Venn diagram
Both diagrams compare two things, so people often ask which one to use.
| Double bubble map | Venn diagram | |
|---|---|---|
| Shape | Two center circles with satellite bubbles | Two overlapping circles |
| Where similarities go | Bubbles linked to both centers | Inside the overlap |
| Room for writing | Each trait gets its own bubble | Space shrinks as the overlap fills up |
| Best for | Listing discrete traits | Showing that two sets intersect |
In practice the double bubble map is easier to fill in when you have many traits, because adding one more bubble costs nothing. A Venn diagram gets cramped once the overlap holds more than a few words. On the other hand, a Venn diagram extends to three sets; a double bubble map is built for exactly two.
Double bubble map examples
These examples show the kind of traits that belong in each zone. Use them as starting points, then check the facts for your own assignment.
Example 1: Frogs vs toads (science)
- Shared: amphibians, lay eggs in water, start life as tadpoles
- Frogs only: smooth, moist skin; long legs built for jumping; usually live near water
- Toads only: dry, bumpy skin; shorter legs, tend to walk or hop; can live farther from water
Example 2: Abraham Lincoln vs George Washington (history)
- Shared: US presidents, led the country through a war, appear on US currency
- Lincoln only: 16th president, led during the Civil War, issued the Emancipation Proclamation
- Washington only: 1st president, commanded the Continental Army, served two terms then stepped down
Example 3: Two characters in a novel (reading)
For a book report, pick two characters and compare how they act, what they want and how they change. Shared bubbles might be "lives in the same town" or "loses a parent". The outer bubbles are where the analysis happens: what each one does with that experience.
Example 4: Renting vs buying a home (everyday decision)
- Shared: monthly housing cost, need a deposit, location affects price
- Renting only: landlord handles major repairs, easier to move, no equity built
- Buying only: builds equity, you pay for repairs, property taxes and closing costs
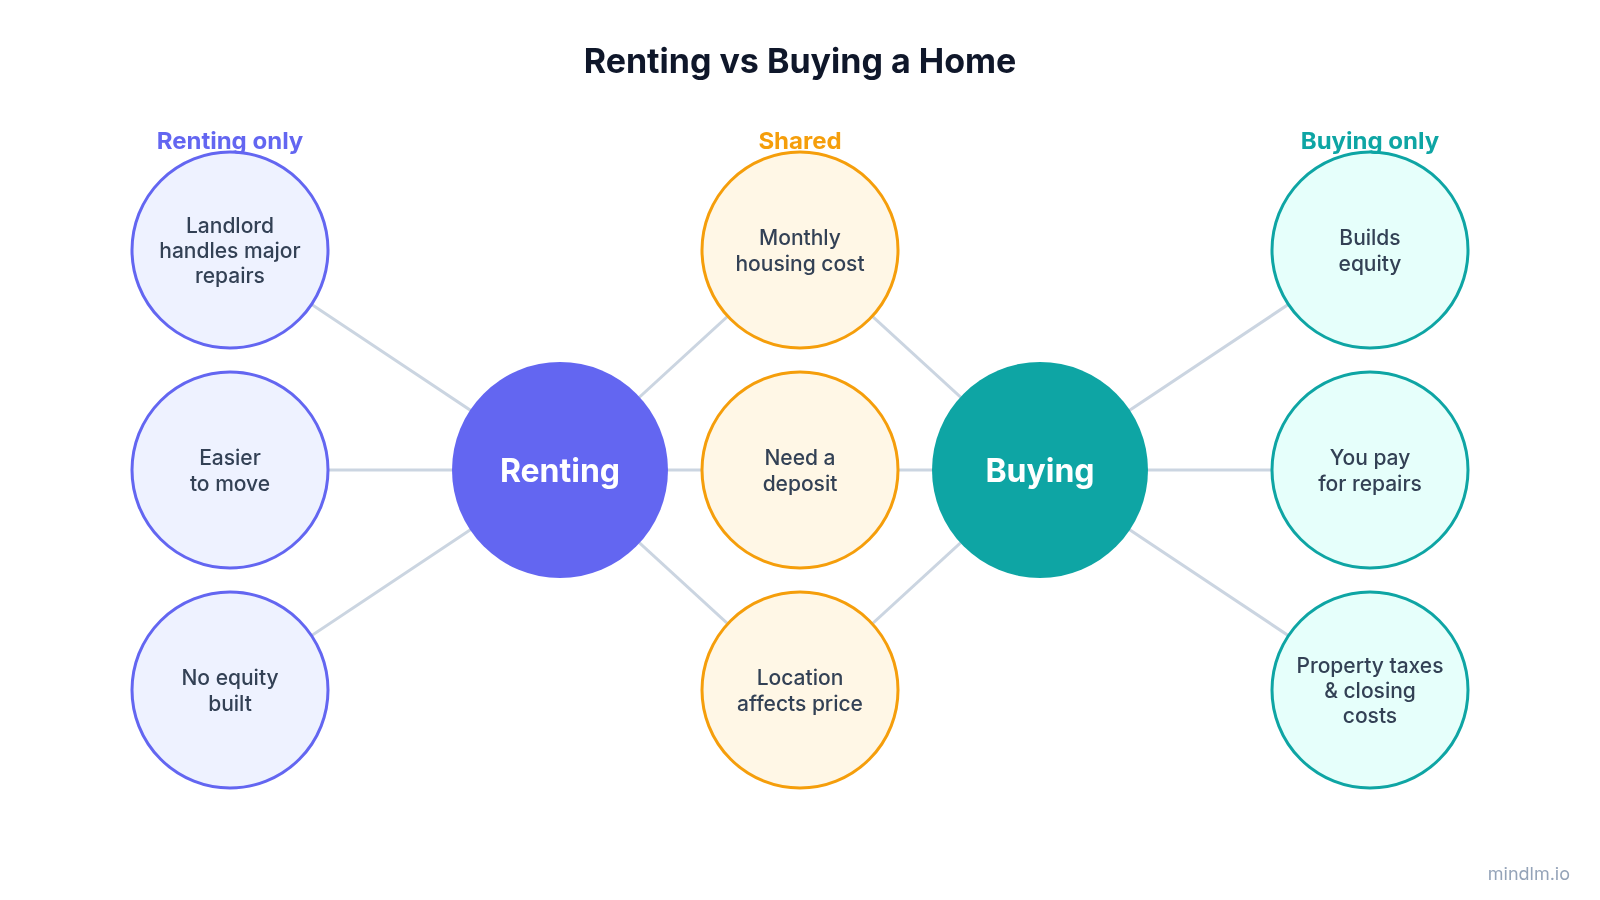
A double bubble map works for adult decisions too, not just classroom topics.
How to draw a double bubble map in 5 steps
- Pick two items at the same level. Compare a frog with a toad, not a frog with "animals". If one item contains the other, you will struggle to find unique traits.
- Brainstorm traits before you draw. Write a plain list of everything you know about each item. Do not sort yet.
- Sort the list into three groups. A trait that applies to both goes in the middle. A trait that applies to only one goes on that side. If a trait is true of both but in different ways (frogs and toads both have legs, but different legs), turn it into two unique bubbles that face each other: "long legs" and "short legs".
- Draw the centers, then the middle, then the sides. Place the two center circles first with plenty of space between them. Fill the shared bubbles next, since they set how wide the diagram needs to be.
- Check every line. Each middle bubble needs two lines; each outer bubble needs exactly one. A missing line changes the meaning.
Tip: try to keep the two sides balanced. If Item A has six unique traits and Item B has one, you probably know one item better than the other, and that gap is worth fixing before you write anything based on the diagram.
Common mistakes
- Putting opinions in bubbles. "Better" or "boring" is not a trait. Write the observable fact behind the opinion.
- Repeating a trait on both sides. If it appears on both outer edges, it belongs in the middle.
- Writing sentences. One to four words per bubble. The diagram is a map of your thinking; the sentences come later in your essay.
- Unpaired differences. The strongest double bubble maps line up opposite traits across from each other (smooth skin vs bumpy skin), which makes the contrast obvious.
From a double bubble map to an essay or outline
Teachers use the double bubble map as the planning step for a compare-and-contrast paragraph or essay. A simple path:
- The middle column becomes your "similarities" paragraph.
- Paired outer bubbles become your "differences" paragraphs, one pair per point.
- Your conclusion says which differences matter most and why.
This is where a hierarchical outline helps. A double bubble map is flat: every trait sits at the same level. An essay needs order: which point comes first, which details support it. Many students redraw their bubbles as an outline or a mind map before writing, with "Similarities" and "Differences" as branches and each trait as a sub-point.
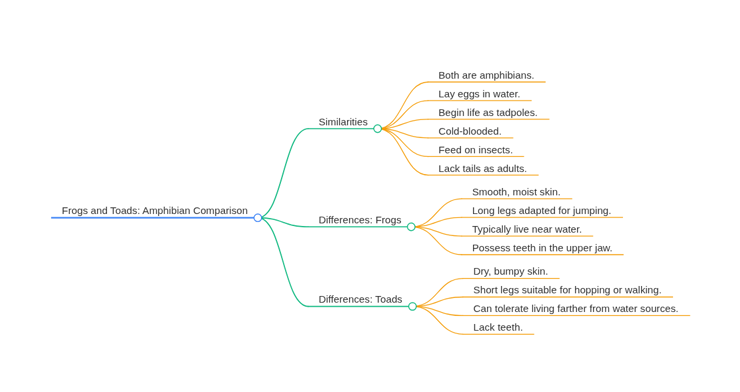
The same frog and toad notes as a mind map, ready to turn into an essay outline.
Where a mind map fits (and where it does not)
MindLM makes mind maps, not double bubble maps. If you need the two-circle diagram itself for a worksheet, draw it by hand or in a general diagram tool.
A mind map earns its place a step earlier or a step later. Before drawing, you might have a page of messy research notes on both items. Paste them into MindLM's text to mind map tool and it groups the notes into topics, which makes the sorting in step 3 faster. After drawing, the mind map gives you the ordered outline your essay needs. The tool works on the page without an account for 3 tries of up to 5,000 characters; signing up for free lets you edit the map and export it as PNG, Markdown or XMind (export options).
If you are writing the essay itself, the essay mind map template shows one way to structure the outline.
FAQ
What is a double bubble map used for?
A double bubble map is used to compare and contrast two things. Students use it to plan compare-and-contrast writing in science, history and reading, for example comparing two animals, two leaders or two characters. Adults use the same layout for decisions such as two job offers or two products, because the shared traits and the real differences end up visually separated.
What is the difference between a bubble map and a double bubble map?
A bubble map describes one thing: a single center circle surrounded by bubbles of adjectives or qualities. A double bubble map compares two things: two center circles, with shared qualities linked to both and unique qualities linked to only one. If your question is "what is it like?", use a bubble map. If it is "how are these two alike and different?", use a double bubble map.
Is a double bubble map the same as a Venn diagram?
They answer the same question but look different. A Venn diagram shows similarities inside the overlap of two circles. A double bubble map gives every trait its own bubble and uses connecting lines to show whether it belongs to one item or both. The bubble version has more room for writing, while the Venn diagram can extend to three sets.
How many bubbles should a double bubble map have?
There is no fixed rule. Many classroom templates provide three to five shared bubbles and three to five unique bubbles on each side, which is enough to support a short essay. More important than the count is balance: aim for roughly the same number of unique traits on each side, and try to pair each difference with its opposite.
Can MindLM create a double bubble map?
No. MindLM generates mind maps, which are hierarchical diagrams with one central topic and branches. It does not draw two-center bubble diagrams. You can still use it to organize your comparison notes into similarities and differences, or to turn a finished double bubble map into an essay outline, then export that mind map as PNG, Markdown or XMind.
Start with a double bubble map, finish with an outline
A double bubble map shows the overlap and the differences at a glance; a mind map turns them into an outline you can write from. Got a pile of notes on two topics?
Related articles
- Concept Map vs Mind Map: How They Differ and When to Use EachConcept map vs mind map: one links ideas with labeled arrows, the other branches out from one topic. Compare structure, examples and when to use each.
- How to Turn a PDF into a Mind Map: Steps and a Paper ExampleTurn a PDF into an editable outline, check a real paper example against its source, then export Markdown for Obsidian. Manual and AI methods covered.
- Best AI Mind Map Generators in 2026 (Compared)Compare 7 AI mind map generators by free credits, PDF input, node editing, and Markdown export. Includes video limits, official sources, and a real paper example.